Cloud teams tell us they want to be able to see security issues in their environment in a central location. Going from one proprietary dashboard to another with several context switches, different query languages and only limited views of the whole picture is not just a very arduous task, it also means that things get missed.
All the visibility, but nothing to see.
ARGOS is laser-focused on cloud configuration, and that makes us amazing at that, but there are other areas that we do not cover, like workloads (Windows/Linux VMs) or network traffic.
All this together can give amazing insights into what is happening in an environment overall.
That is why ARGOS, by customer demand, is starting to integrate with several SIEM providers. Microsoft Sentinel (formerly Azure Sentinel) is the first one.
Configuring the Sentinel Integration
In order to integrate ARGOS to Microsoft Sentinel there are a few prerequisites that need to be available.
- Azure Log Analytics Workspace
- Microsoft Sentinel enabled on the Log Analytics Workspace
- Browse to https://app.argos-security.io/account/sentinel
- Open a new browser tab and find your Log Analytics Workspace on https://portal.azure.com . Under “Agents management” take note of your Workspace ID and Primary Key.
- Paste both the Workspace ID and Primary Key into the ARGOS dashboard.
Helpful Microsoft Sentinel Queries
Once this integration is enabled any new ARGOS detections will be available. Here are some interesting and helpful queries to get you started.
Either via Log Analytics, Azure Monitor or Microsoft Sentinel, access your Logs tab.
This following query will show you all the events, unfiltered.
ARGOS_CL
This query will show all exploitable detections on Azure, that are currently still open and sorts them by the time they were generated.
ARGOS_CL | where exploitable_b and cloud_s == 'azure' and status_s == 'open' | sort by TimeGenerated
This query will render a time chart with all open ARGOS Detections on Azure.
ARGOS_CL | where cloud_s == 'azure' and status_s == 'open' | summarize count() by TimeGenerated | render timechart
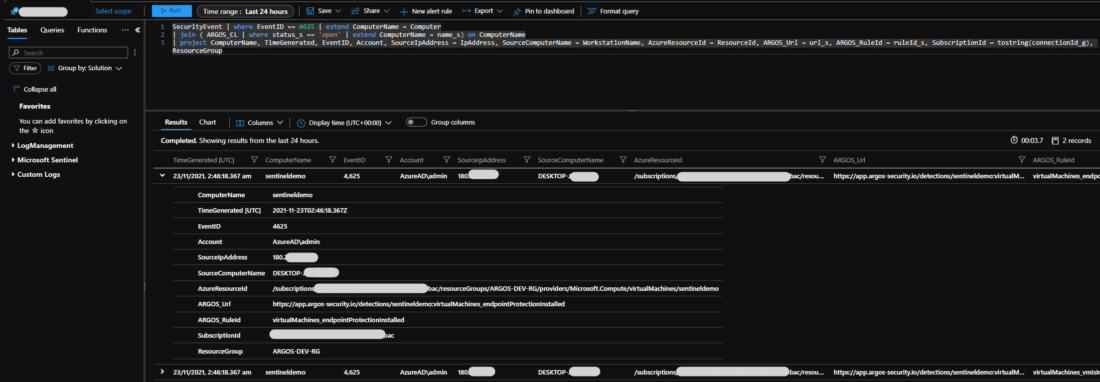
Now, this one here will not just show you the ARGOS detections, but will show you all Azure VMs that have failed logon attempts via RDP and map those to any ARGOS detection for that VM.
SecurityEvent | where EventID == 4625 | extend ComputerName = Computer
| join ( ARGOS_CL | where status_s == 'open' | extend ComputerName = name_s) on ComputerName
| project ComputerName, TimeGenerated, EventID, Account, SourceIpAddress = IpAddress, SourceComputerName = WorkstationName, AzureResourceId = ResourceId, ARGOS_Url = url_s, ARGOS_RuleId = ruleId_s, SubscriptionId = tostring(connectionId_g), ResourceGroup
You can from here even create an alert rule for any of these queries.
Free Trial
Test ARGOS and the Microsoft Sentinel integration for 30 days, for free, by signing up at https://argos-security.io and see how much time you can save on manually investigating your cloud security issues.


